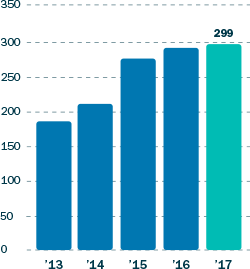
$299m
3.2%

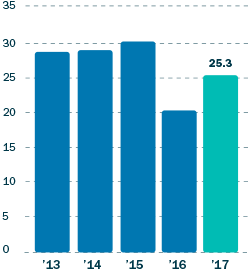
$25.3m
26.2%
$493.0m
29.4%
12.4%
16.2¢
Per share
8.0¢
Per share
56.1%


*Continuing business, does not include
Receivables Management business

With focus on two core businesses - consumer leasing and business finance - both generating an attractive return on capital.

Refining application-to-approval process and improving the customer experience.

Strong relationships with brokers and strategic partners resulting in receivables growth of 80 per cent in equipment finance, with the division now a significant contributor to group earnings diversity.